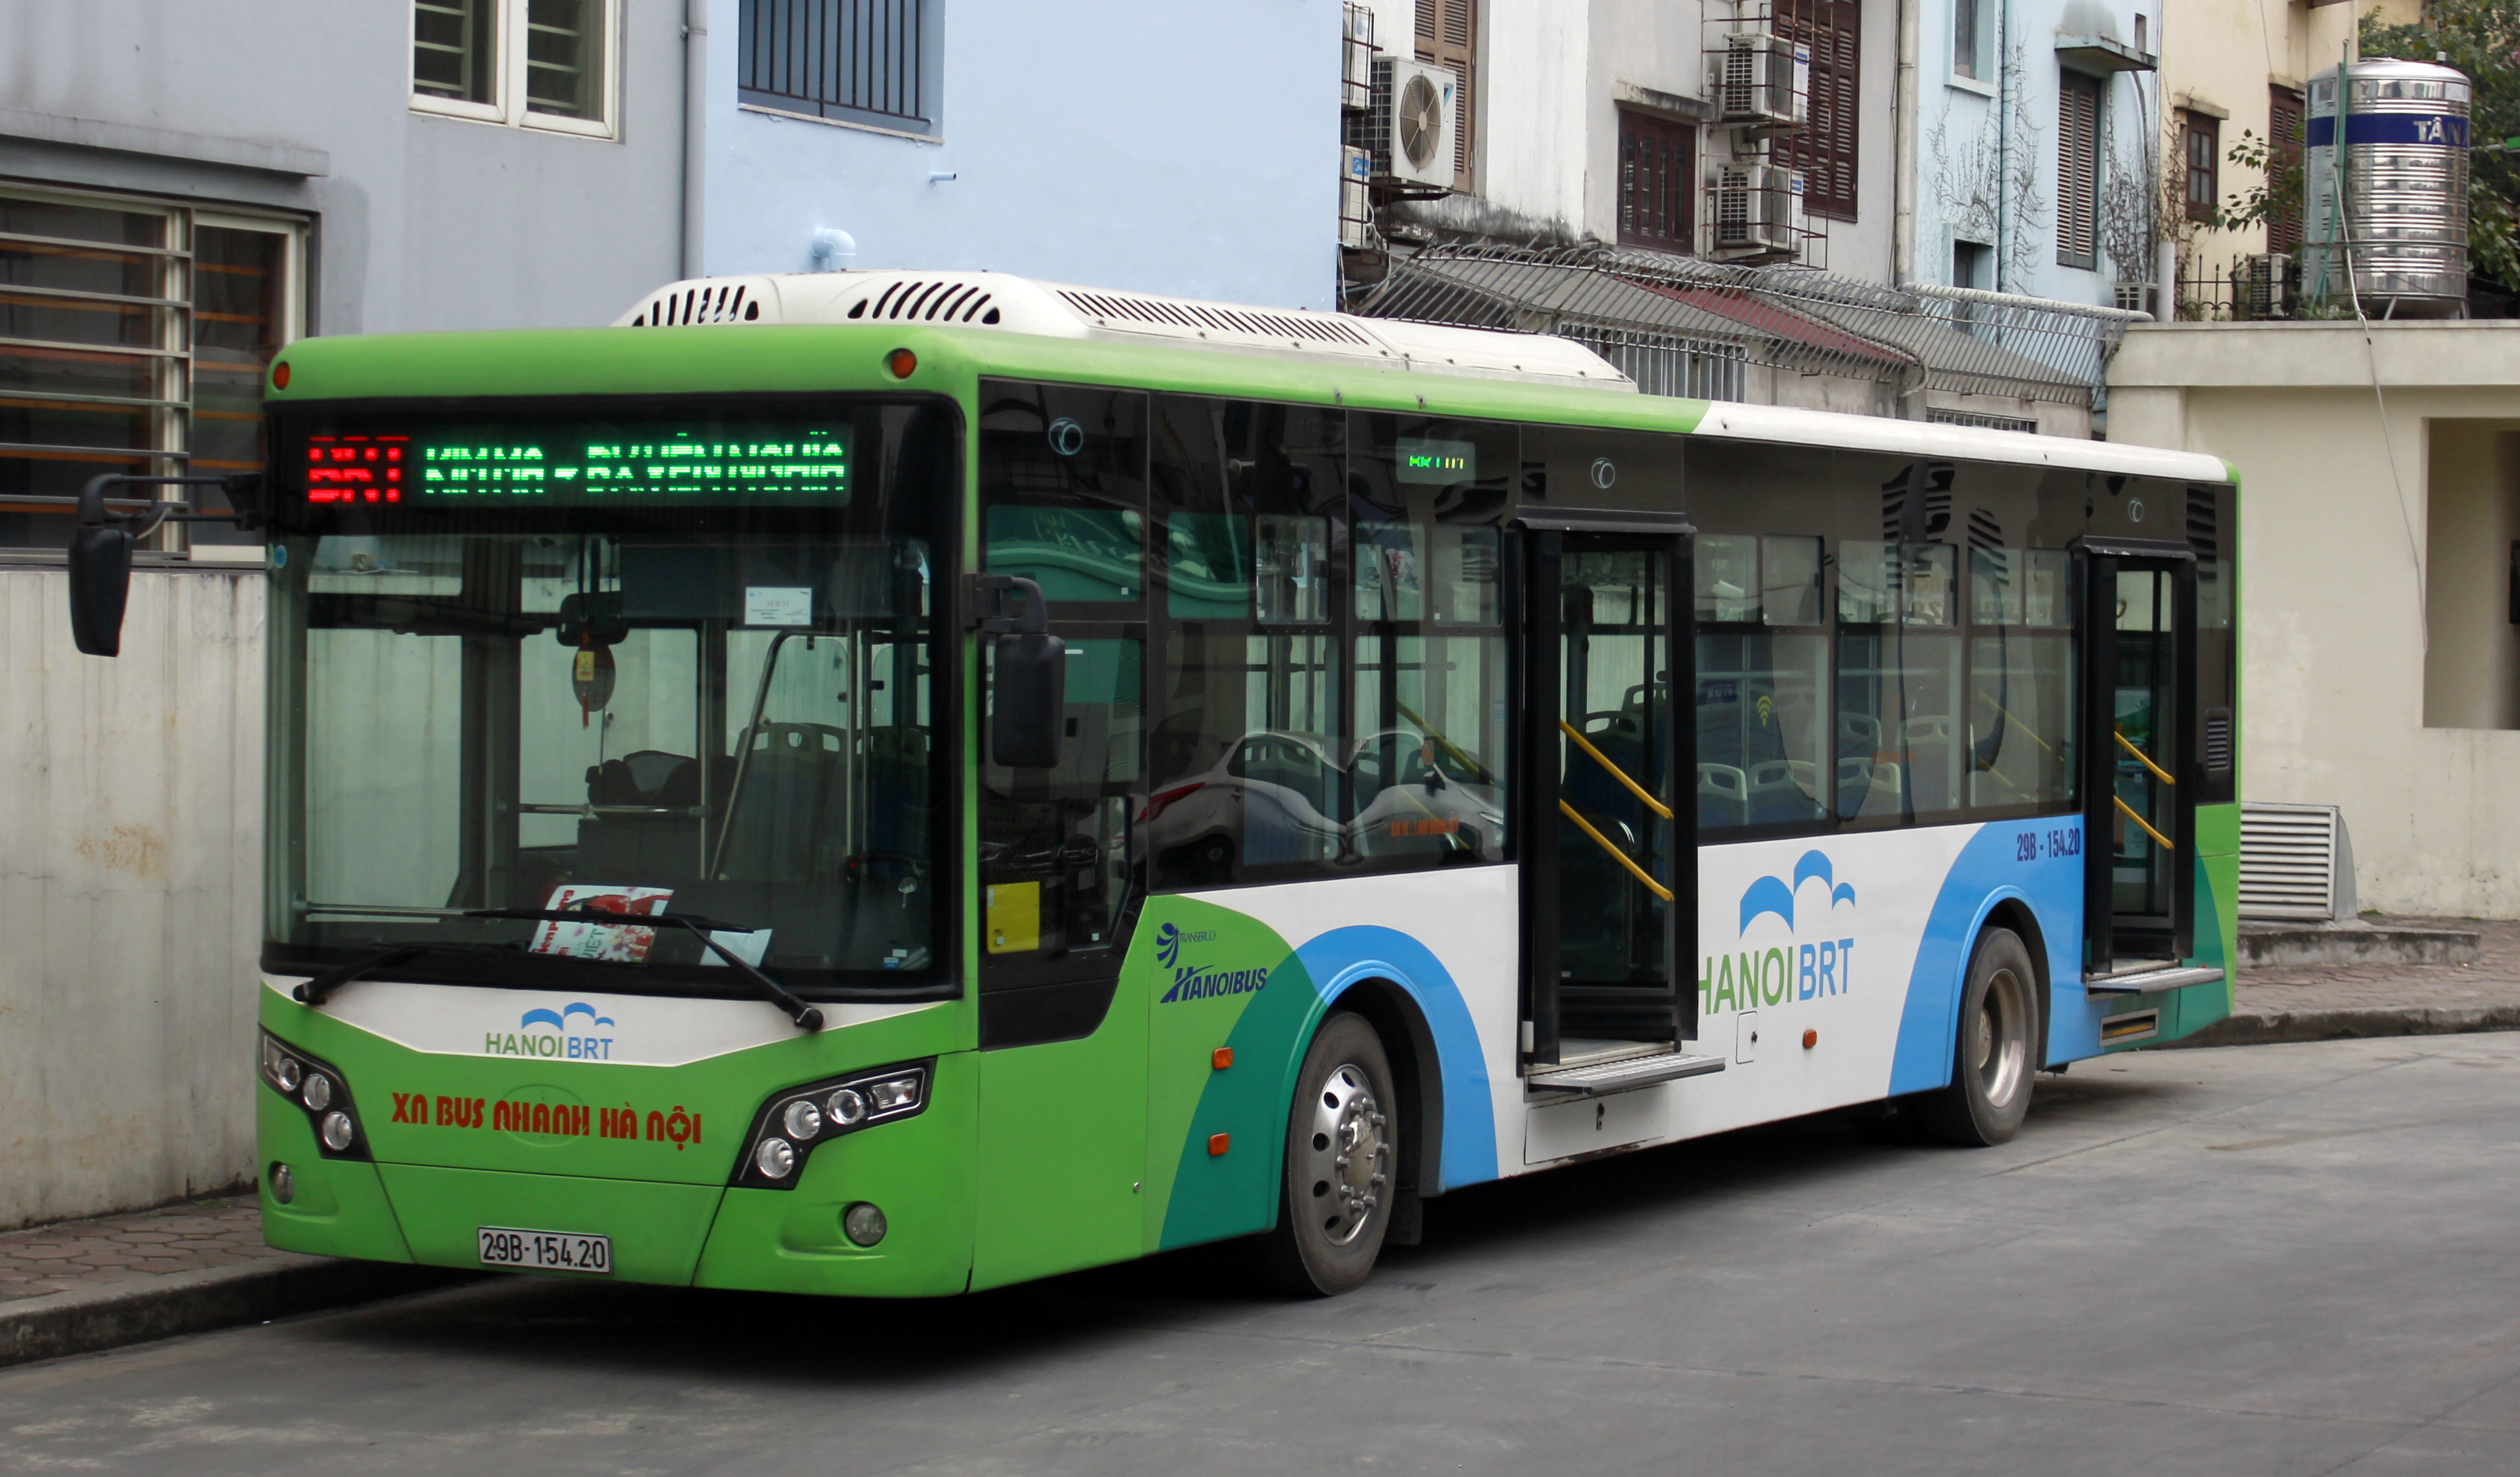
Back to All Research
Hanoi transport transition | plain-language policy brief

Motorbike Phase-Out Policy Acceptance

This page explains one core question in plain language: how Hanoi can phase out fossil-fuel motorbikes while keeping daily travel reliable and affordable. The main finding is stable across the evidence shown here: public acceptance is stronger when better alternatives and support come first, then restrictions scale gradually.

Context updated: February 2026 Hanoi transition design Method: DCE (discrete choice experiment) Timeline covered: 2026-2030
Why change is needed What residents worry about What order works best How rollout should be paced What to check before each step
Pull first, then restrict Service reliability before hard bans Support depth drives fairness perception Gate-based expansion reduces backlash Public trust changes real outcomes Emission goals need adoption pathways Pull first, then restrict Service reliability before hard bans Support depth drives fairness perception Gate-based expansion reduces backlash Public trust changes real outcomes Emission goals need adoption pathways
Newcomer Guide

New here? Read this first

This research is mainly about policy order, not about whether Hanoi should reduce transport emissions. The practical question is how to phase restrictions in a way that people can realistically follow.

What problem is being solved?

Hanoi has high motorbike dependence and high traffic-related pollution pressure.

What does the study test?

How residents react to different bundles of restrictions, alternatives, and support measures.

Main takeaway in one line

Build reliable alternatives and transition support first, then tighten restrictions in stages.

How to read this page fast

Use the snapshot section, test one simulator scenario, then check the checkpoint metrics and source tiers.

Pull = improve alternatives Push = tighten restrictions Support = protect vulnerable users Gate = pause-or-go checkpoint
Research Snapshot

Research Question and Main Takeaway

What rollout order can reduce fossil-fuel motorbike use in Hanoi while still feeling fair and workable for everyday commuters?

Registered vehicles (Hanoi)

8M+ (official 2025 estimate)

Fleet mix (Hanoi)

6.9M motorbikes, 1.1M cars

Traffic pollution share

58-74% (city-reported)

Study sample + model fit

n = 320; fit: rho2 = 0.28; status-quo effect: ASC = +1.621

Best sequence

Improve alternatives + support first, then tighten restrictions gradually

Hanoi's transport system is under heavy pressure: official reporting notes more than 8 million registered vehicles, plus about 1.2 million additional vehicles entering the city each day. The transition is urgent, but rollout mistakes can create major social and economic friction.

Daily travel dependence

Because motorbikes are central to daily travel, replacement options must be reliable before restrictions rise.

Household cost pressure

If transition costs jump too quickly, many households may prioritize affordability over policy goals.

Gradual rollout matters

Acceptance is higher when timeline changes feel staged and predictable instead of abrupt.

Confidence in alternatives

People are more willing to accept restrictions when transport alternatives actually work day to day.

Unequal burden risk

Delivery riders and low-income commuters absorb transition shocks first if support is weak.

Clear communication

Simple phase rules and checkpoints reduce confusion and improve follow-through.

Policy Timeline

Policy Timeline and Readiness Checkpoints (2025-2030)

2025: LEZ pilot starts in central districts

Hanoi piloted low-emission-zone controls in central districts, creating an early implementation layer before wider scale-up.

July 1, 2026: Ring Road 1 fossil-motorbike restriction

City communication confirms that only electric motorcycles will be allowed inside Ring Road 1 from this date.

January 1, 2028: Expansion to Ring Road 2 scope

Restriction scope expands to Ring Roads 1-2 with no fossil motorcycles and mopeds in these zones, plus tighter limits on fossil-fuel cars.

January 1, 2030 onward: Ring Road 3 extension and post-2035 controls

Roadmap language extends low-emission controls to the area within Ring Road 3 by 2030, while setting up stricter city-level fossil-vehicle controls from 2035.

Key years: 2026, 2028, 2030 Fleet pressure: 8M+ registered + inflow traffic 100% green bus/taxi target by 2030 LEZ starts in central wards

Pilot phase

Start in compact zones to test communication and mobility alternatives.

First restriction phase

Apply Ring Road 1 limits only when fallback options are operating reliably.

Expansion phase

Scale to Ring Road 2 only with monitored acceptance and affordability checkpoints.

Scale phase

Tie 2030 expansion goals to transparent progress metrics and support quality.

Interactive Policy Lab

Try Policy Mixes Before Real Enforcement

This simulator is illustrative and designed for communication, not forecasting. It helps compare policy mixes and shows how readiness, household burden, trust, and stage-by-stage rollout workability move together.

Step 1: Set push, pull, support, and trust Step 2: Compare acceptance, burden, and readiness Step 3: Use guidance as discussion prompts
39%

Higher values represent faster and wider restriction enforcement.

74%

Represents public transport reliability, clean mobility access, and route coverage.

74%

Represents conversion grants, credit access, and livelihood support.

68%

Reflects perceived transparency, fairness, and policy predictability.

Acceptance score

0/100

Rollout status

Pending

Pull Support Calibrate Restrict
Illustrative console for communication only. Use it to stress-test sequence logic, not to replace formal impact evaluation.

Alternative readiness

0%

Burden pressure

0%

Transition trust

0%

Diagnostic gaps

Readiness gap

0 pts

Compensation gap

0 pts

Trust buffer

0 pts

High-acceptance chance

0%

Primary lever

-

Phase readiness

Pull

0%

Support

0%

Calibrate

0%

Restrict

0%

Policy guidance

Adjust policy mix to reduce burden before scale-up.

  • Waiting for scenario input.
Evidence Board

Local Model Signals + External Context

Why urgency is rising

Emissions trend explains why action is needed, but not which rollout order will work best.

What the Hanoi model indicates

DCE outputs show which policy mix can improve acceptance while still moving toward restriction goals.

How to apply it

Convert findings into phased checkpoints, then monitor burden and trust continuously.

Context pressure: transport emissions are still rising

Our World in Data (Global Carbon Budget series) shows Vietnam transport CO2 reached about 45.36 Mt in 2023 versus 30.06 Mt in 2012. The climate rationale for transition is strengthening, while local delivery constraints remain material.

Vietnam transport CO2 emissions trend from Our World in Data
Vietnam transport CO2 trend from Our World in Data.
Hanoi DCE willingness-to-pay balance for phase-out attributes
Reported DCE values suggest residents react more negatively to restriction-heavy bundles and more positively to support-oriented bundles.

How to convert evidence into rollout decisions

The trade-off map and sequencing board are derived and illustrative modules. They help translate model direction into practical rollout choices for workshops and governance discussions.

Policy acceptance trade-off map for push, pull, and support levers
Derived map for discussing burden-versus-acceptance trade-offs.
Illustrative sequencing index comparison across rollout pathways
Illustrative index: push-first is lowest, while pull plus support is highest.
International Transfer

What External Evidence Suggests for Hanoi

ULEZ compliance (Outer London)

96.7%

PM2.5 from road transport

31% lower vs no-ULEZ case

Global e-2/3 wheelers

Projected 170M by 2030

LEZ review signal

NO2 and PM2.5 reductions observed

Transferable lesson: restriction policy can deliver environmental gains when compliance pathways are practical. Hanoi has much deeper motorbike dependency than many LEZ cases, so support depth and sequencing discipline are critical.

Air-quality co-benefits are plausible Equity design drives acceptance Electric 2/3-wheelers are scaling globally Compliance improves with alternatives
Implementation Playbook

Step-by-Step Rollout Plan (2026-2030)

Phase 1 (Now to July 2026): readiness first

Before the Ring Road 1 restriction date, prioritize bus reliability, transparent support eligibility, and district-level communication focused on alternatives rather than penalties.

Phase 2 (2026 to 2027): protect vulnerable mobility users

Target delivery riders, low-income commuters, and service workers with conversion grants, financing pathways, and route-level transition assistance to prevent livelihood shock.

Phase 3 (From January 2028): conditional expansion to Ring Road 2

Expand only when readiness and trust indicators remain stable through repeated monitoring cycles. If not, pause and intensify support before further restriction.

Phase 4 (2030 horizon): scale with accountability

Use hard checkpoints for transport reliability, affordability, and compliance quality before extending full restriction scope toward Ring Road 3.

Phase 1

Readiness and communication stabilization before restrictions.

Phase 2

Support intensity rises for mobility-vulnerable groups.

Phase 3

Conditional scale-up tied to trust and affordability metrics.

Phase 4

Accountable expansion with transparent compliance monitoring.

Monitoring Architecture

Checkpoint Metrics Before Each Restriction Step

A checkpoint means pause-or-go: if indicators weaken, delay the next restriction stage and stabilize services/support first.

Gate 1: Service readiness before enforcement

Publish corridor-level transit reliability and replacement-mobility coverage before each milestone. If readiness drops, defer restriction expansion and prioritize service stabilization.

Gate 2: Transition support coverage

Track conversion support reach among high-exposure groups such as delivery workers and low-income commuters. Scale support first when affordability pressure rises.

Gate 3: Trust and compliance quality

Release monthly compliance, grievance, and enforcement-quality dashboards. Rising dispute intensity should trigger communication and policy-calibration cycles.

Gate 4: Outcome accountability

Monitor air-quality outcomes (for example PM2.5 and NO2) alongside social-impact indicators, so environmental gains are not purchased with disproportionate burden.

Use pre-defined thresholds per gate Review monthly, publish quarterly Segment by vulnerable commuter groups Pause expansion when indicators weaken
Plain-Language Glossary

Quick Definitions for Newcomers

These terms appear across the page. Use this short decoder if you are not from a policy or modeling background.

Push

Restriction and enforcement measures, such as limiting fossil-fuel motorbike access in specific zones.

Pull

Improvements that make alternatives attractive and usable, such as bus reliability and route coverage.

Support

Policies that reduce transition pain, such as grants, financing support, and livelihood protection.

Gate / checkpoint

A pause-or-go review point before scaling restrictions to the next area or phase.

DCE (discrete choice experiment)

A survey method where people choose between policy bundles, allowing estimation of preference trade-offs.

rho2 and ASC

Model summary metrics: rho2 indicates fit quality, while ASC captures baseline preference for the current situation.

Sources and Tiers

Evidence Strength: Verified, Reported, and Illustrative

Study evidence-tier boundary

Reported: directly sourced values such as n = 320, rho2 = 0.28, ASC = +1.621, and displayed preference directions. Derived: translated products such as the policy trade-off map. Illustrative: communication tools such as the simulator and sequencing index (not causal forecasts). Last source pass on this page: February 24, 2026.

Reported Data Derived Translation Illustrative Simulation Policy Timeline External Benchmarks Primary sources prioritized Updated February 2026